| San Mateo Coastside | Apr-14 | Mar-15 | Apr-15 | MoM* | YoY * |
| Closed Sales, $ Volume | $43,555,800 | $47,053,100 | $69,077,888 | 46.8% | 58.6% |
| Closed Sales, # Homes | 53 | 52 | 68 | 30.8% | 28.3% |
| Number of Homes Active | 126 | 74 | 76 | 2.7% | -39.7% |
| Number of Homes Pending | 65 | 60 | 73 | 21.7% | 12.3% |
| Months of Inventory | 2.4 | 1.4 | 1.1 | -21.4% | -54.2% |
| Median Days on Market | 10 | 12 | 12 | 0.0% | 20.0% |
| Ave Days on Market | 29 | 32 | 29 | -9.4% | 0.0% |
| Median Sale Price | $730,000 | $851,125 | $862,500 | 1.3% | 18.2% |
| Ave Sale Price | $821,808 | $904,867 | $1,015,851 | 12.3% | 23.6% |
| Ave Price per Square Foot | $495 | $525 | $551 | 5.0% | 11.3% |
| Sold Price vs. Asking Price | 102.9% | 102.2% | 105.1% | 2.8% | 2.1% |
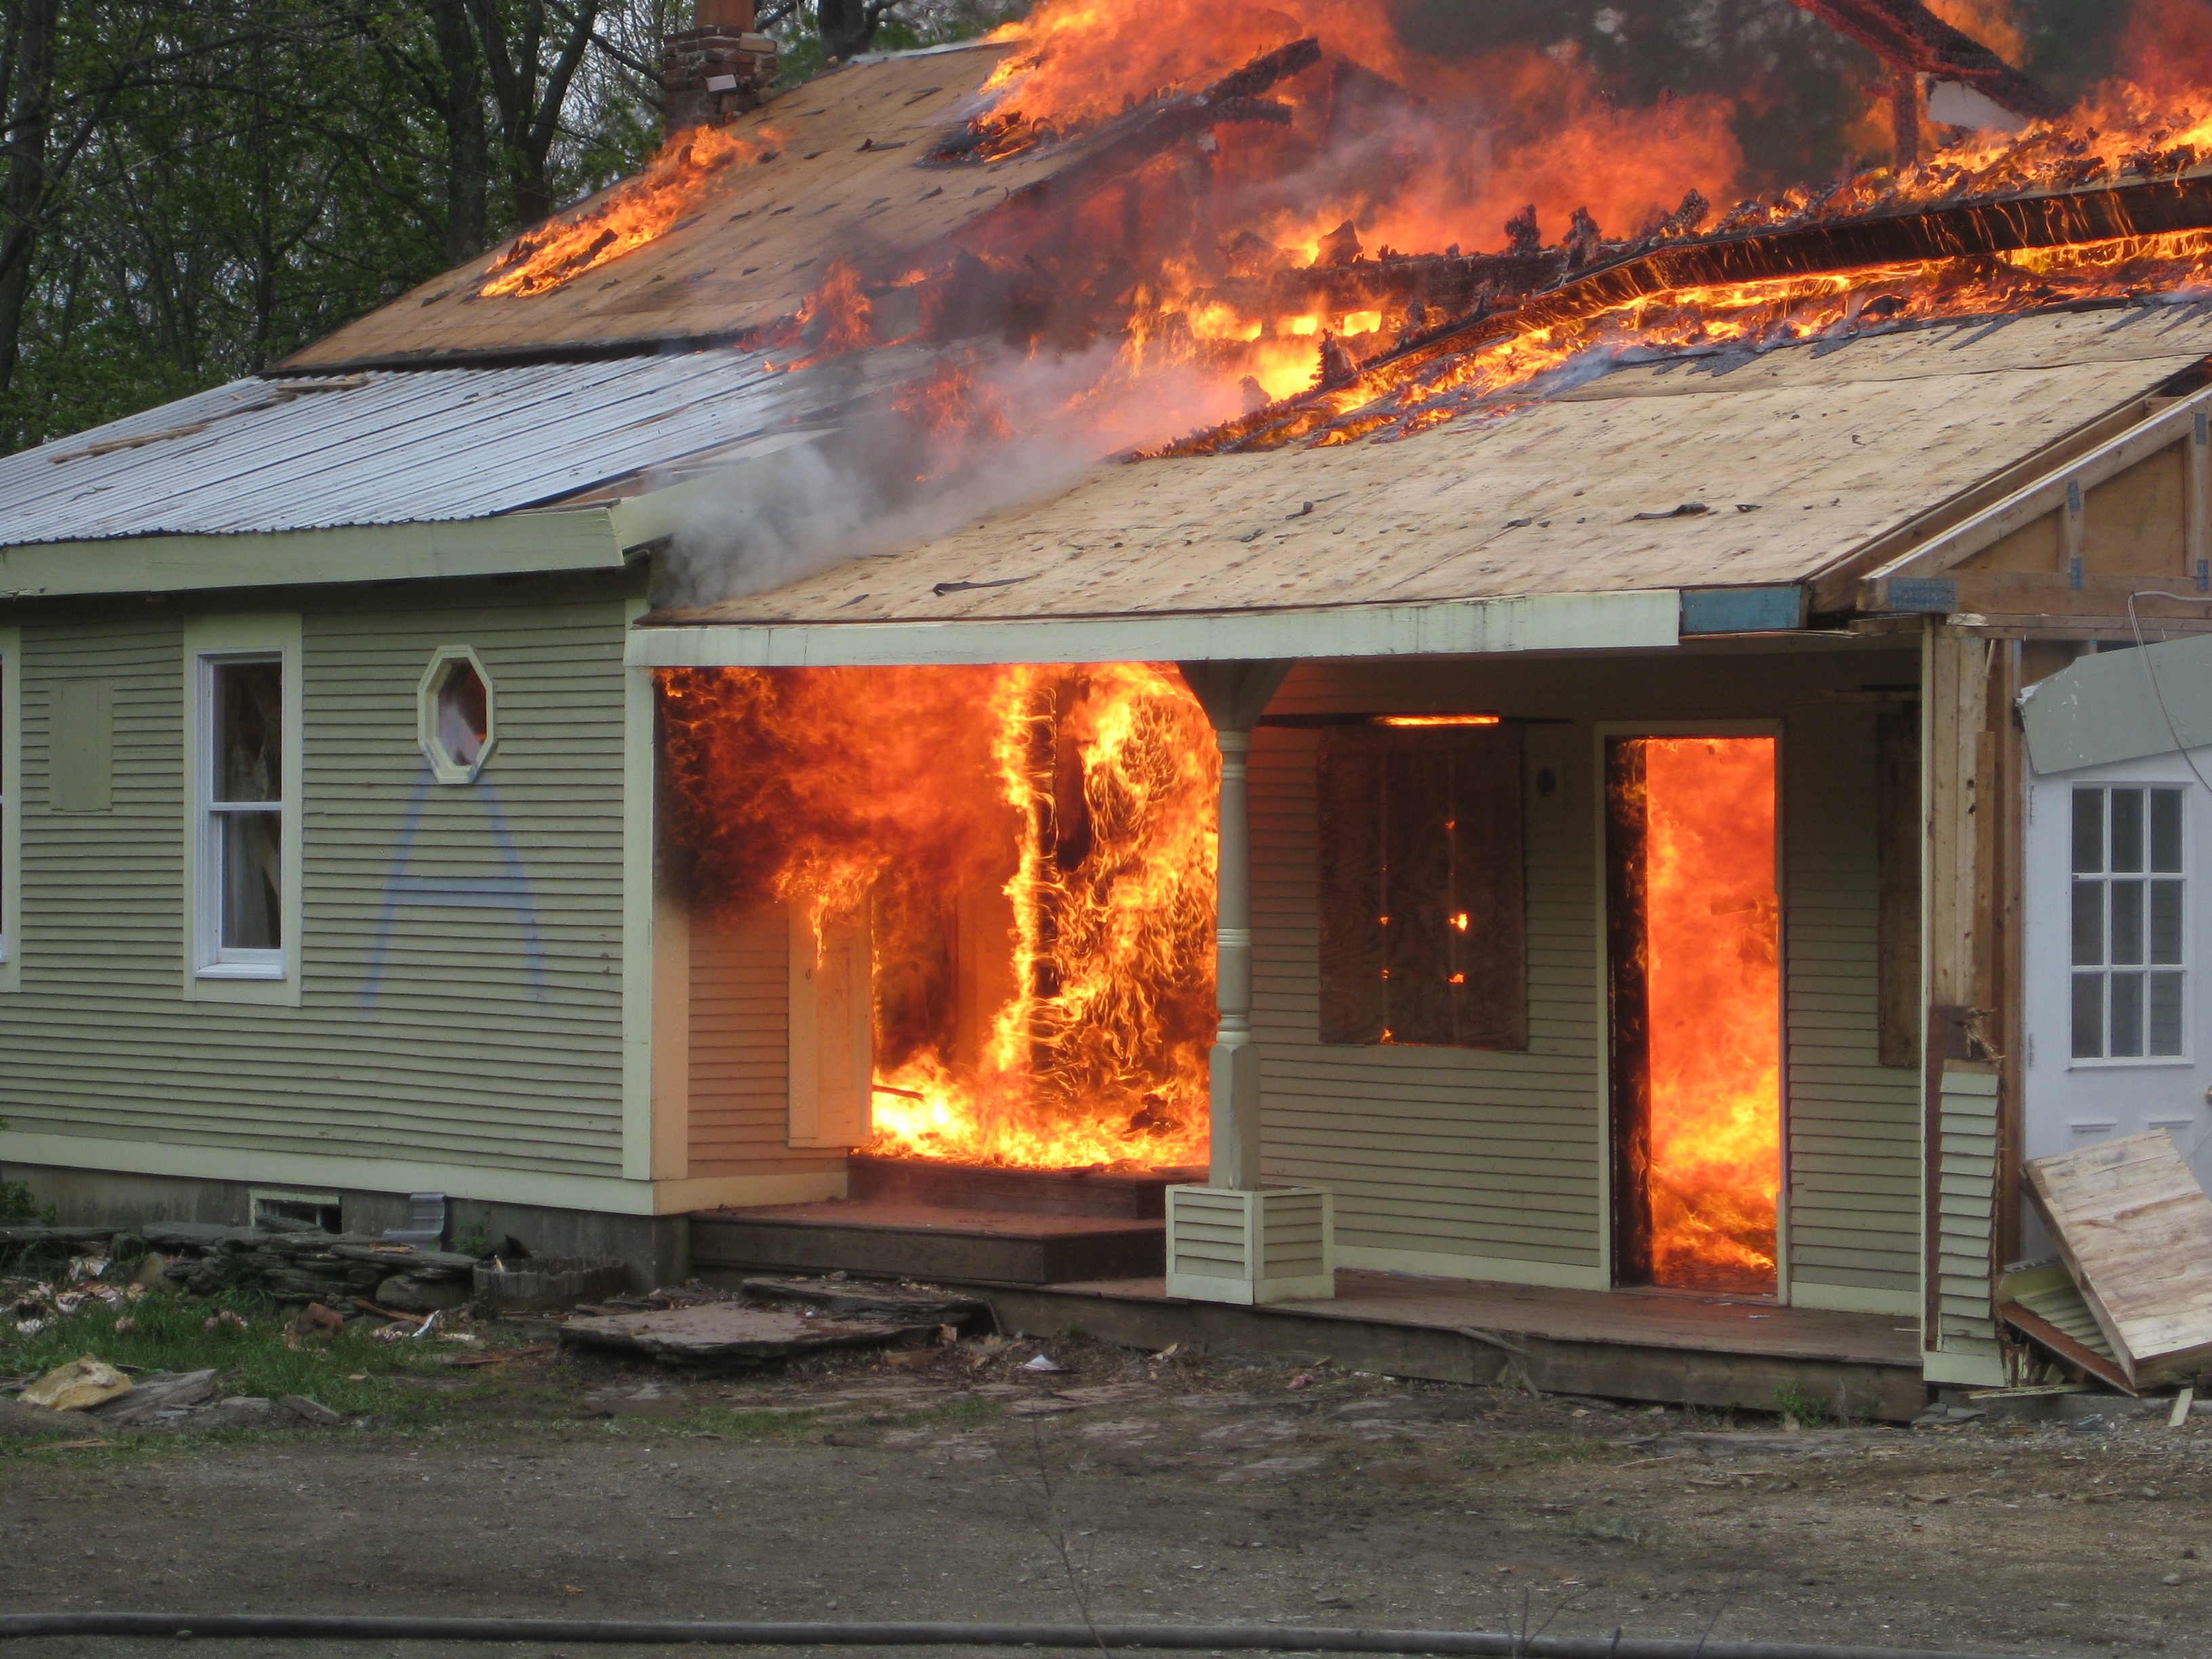
There is only one way to describe the Coastside real estate market in April — Hot, Hot, Hot!! “On Fire” may actually be more appropriate. Nearly all the metrics above confirm the tongue-in-cheek analogy. There were 68 homes sold on the Coastside in April, roughly 30 percent more than last year. Months of Inventory on the market shrunk to less than half last year’s supply. Home prices as measured by Median Sale Price, Average Sale Price, and Average Price per Square Foot were all up sharply versus last year. However, the telltale sign of a market on fire is the Sold vs. Asking Price Ratio. Anything over 100% indicates a good seller’s market since the buyers are on average paying more than what the sellers are asking. Last month, the Sold vs. Asking Price Ratio was 105.1%! The highest number in the over 10 years. The crazy thing is May looks to be even hotter, ouch!
This market update includes market data for single family homes in Pacifica, Montara, Moss Beach, El Granada, Half Moon Bay, Pescadero, La Honda, and San Gregorio as provided by MLS Listings, Inc. and CoreLogic.
* MoM = Month over month change, YoY = Year over year change