Coastside Real Estate Update March 2017

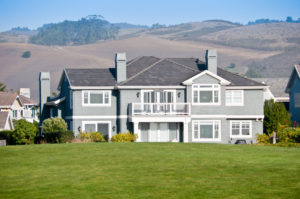
shutterstock_41230294


San Mateo Coastside Feb-16 Jan-17 Feb-17 MoM* YoY *
Closed Sales, $ Volume $31,441,012 $27,275,857 $24,778,550 -9.2% -21.2%
Closed Sales, # Homes 29 25 24 -4.0% -17.2%
Number of Homes Active 66 71 60 -15.5% -9.1%
Number of Homes Pending 42 32 37 15.6% -11.9%
Months of Inventory 2.3 2.8 2.5 -10.7% 8.7%
Median Days on Market 17 20 20 0.0% 17.6%
Ave Days on Market 75 20 14 -30.0% -81.3%
Median Sale Price $875,000 $928,357 $883,500 -4.8% 1.0%
Ave Sale Price $1,084,173 $1,091,034 $1,032,440 -5.4% -4.8%
Ave Price per Square Foot $611 $640 $572 -10.6% -6.4%
Sold Price vs. Asking Price 103.2% 101.5% 99.8% -1.7% -3.3%


Signs of a shift in the coastside real estate market are beginning to surface. Sales volume is down month over month and year over year. Median days on the market is creeping up to 3 weeks from 2.5 weeks last year. Median sales prices are holding their own, but average sales prices are notably down. However, the most telling stat is the sold vs asking price ratio which dipped slightly below the 100 percent threshold for the first time in two years. Ratios dropping below 100% historically correlate to a shift from a seller’s market to a buyer’s market. Rising mortgage rates may be beginning to drag on the market, but with a scant 60 homes for sale it’s bound to be a tug of war.

This market update includes market data for single family homes in Pacifica, Montara, Moss Beach, El Granada, Half Moon Bay, Pescadero, La Honda, and San Gregorio as provided by MLS Listings, Inc. and CoreLogic.

* MoM = Month over month change, YoY = Year over year change
Coastside Real Estate Update November 2015

Point_Montara_Light_(2013)


San Mateo Coastside Nov-14 Oct-15 Nov-15 MoM* YoY *
Closed Sales, $ Volume $55,126,250 $44,954,900 $39,639,000 -11.8% -28.1%
Closed Sales, # Homes 51 49 37 -24.5% -27.5%
Number of Homes Active 88 94 75 -20.2% -14.8%
Number of Homes Pending 30 59 43 -27.1% 43.3%
Months of Inventory 1.7 1.9 2.0 5.3% 17.6%
Median Days on Market 26 15 16 6.7% -38.5%
Ave Days on Market 57 35 38 8.6% -33.3%
Median Sale Price $870,000 $830,000 $920,000 10.8% 5.7%
Ave Sale Price $1,080,907 $917,447 $1,071,324 16.8% -0.9%
Ave Price per Square Foot $538 $564 $556 -1.4% 3.3%
Sold Price vs. Asking Price 101.8% 104.5% 102.1% -2.3% 0.3%


This market update includes market data for single family homes in Pacifica, Montara, Moss Beach, El Granada, Half Moon Bay, Pescadero, La Honda, and San Gregorio as provided by MLS Listings, Inc. and CoreLogic.

* MoM = Month over month change, YoY = Year over year change

Coastside Real Estate Update July 2015

HMB Wine & Cheese Small


San Mateo Coastside Jul-14 Jun-15 Jul-15 MoM* YoY *
Closed Sales, $ Volume $46,434,982 $44,359,043 $51,721,600 16.6% 11.4%
Closed Sales, # Homes 57 47 53 12.8% -7.0%
Number of Homes Active 141 88 85 -3.4% -39.7%
Number of Homes Pending 64 50 51 2.0% -20.3%
Months of Inventory 2.5 1.9 1.6 -15.8% -36.0%
Median Days on Market 16 13 14 7.7% -12.5%
Ave Days on Market 33 17 28 64.7% -15.2%
Median Sale Price $755,000 $801,000 $855,000 6.7% 13.2%
Ave Sale Price $814,649 $943,597 $975,879 3.4% 19.8%
Ave Price per Square Foot $513 $594 $576 -3.0% 12.3%
Sold Price vs. Asking Price 101.8% 105.3% 102.8% -2.4% 1.0%


Looking at the numbers for July, everything continues to look good for sellers of San Mateo Coastside real estate. The scorching hot spring market has cooled slightly, but is still quite hot. The average sale price for a Coastside single family home was $975,879 in July up from only $814,659 last year for a nice rise of 19.8 percent. Median sale prices and price per square foot trends show similar strong growth. Inventory was still low compared to last year with 1.6 months of homes on the market down from 2.5 months last year, but higher than the ridiculously low 1.2 months of inventory we saw in April. Homes continue to sell fast.  It took only 14 days to sell a home in July, one day more that the previous month (median). One sign of waining strength in the market is the month over month decrease in the Sold Price vs. Asking Price ratio backing off to 102.8 percent from a super strong 105.3% in June. Anything over 100 indicates a sellers market and it certainly is still that.  It will be interesting to see if the recent volatility in the stock market has any impact on the real estate data for August. We’ll see soon enough.

This market update includes market data for single family homes in Pacifica, Montara, Moss Beach, El Granada, Half Moon Bay, Pescadero, La Honda, and San Gregorio as provided by MLS Listings, Inc. and CoreLogic.

* MoM = Month over month change, YoY = Year over year change

Coastside Market Update Feb 2015


San Mateo Coastside Feb-14 Jan-15 Feb-15 MoM* YoY *
Closed Sales, $ Volume $26,659,000 $20,204,000 $33,125,000 64.0% 24.3%
Closed Sales, # Homes 31 25 30 20.0% -3.2%
Number of Homes Active 112 65 63 -3.1% -43.8%
Number of Homes Pending 40 37 45 21.6% 12.5%
Months of Inventory 3.6 2.6 2.1 -19.2% -41.7%
Median Days on Market (sold) 44 16 32 100.0% -27.3%
Ave Days on Market (sold) 69 27 105 288.9% 52.2%
Median Sale Price $696,000 $770,000 $906,500 17.7% 30.2%
Ave Sale Price $859,968 $808,160 $1,104,167 36.6% 28.4%
Ave Price per Square Foot (sold) $516 $492 $585 18.9% 13.4%
Sold Price vs. Asking Price 102.5% 102.6% 99.8% -2.7% -2.6%


Single family home sales volume on the Coastside exploded in February.  Sales by dollar volume increased 64% over the previous month and 24% over the same time last year.  Several positive factors came together to create an exceptionally fast moving seller’s market.  Interest rates that looked like they were heading up early in the year settled back down in February possibly inspiring on-the-fence buyers into action.  A wave of new inventory also came on the market late in January allowing sidelined buyers to jump in aggressively.  Strong upward price moves in neighboring communities on the peninsula and in the valley have created some dramatic relative home values on the coast.  The spectacular weather also no doubt played a role.  Perhaps motivating a few blizzard weary New England visitors to relocate.  Unfortunately, the rash of buying during the month did leave us with only 63 active homes on the market at the end of February down from 112 last year.  Not surprising, average and median home prices also moved up sharply last month as did average prices as measured on a “per square foot” basis.  Much of the rest of the data in the chart above was influenced by the sale of a few large estates on the south coast that had been on the market a while skewing Days on the Market and Sold vs. Asking price ratios.  Still a wonderful way to start off the spring selling season.

This market update includes market data for single family homes in Pacifica, Montara, Moss Beach, El Granada, Half Moon Bay, Pescadero, La Honda, and San Gregorio as provided by MLS Listings, Inc. and CoreLogic.

* MoM = Month over month change, YoY = Year over year change